Siemens offers both automotive embedded software and embedded software engineering solutions. Siemens has discontinued offering standalone embedded software for SoCs with the retirement in November 2023 of the Nucleus, Nucleus Hypervisor, Nucleus ReadyStart, Sokol Flex Linux, Sokol Omni Linux, and Sourcery CodeBench products (including associated add-ons). Existing support contracts for these products are still being honored, please contact Siemens Support Center for more information.
What are the different types of embedded software and their purposes?
- Operating system – An operating system (OS), in its most general sense, is software that allows a user to run other applications on a computing device. The operating system manages a processor's hardware resources, including input devices such as a keyboard and mouse, output devices such as displays or printers, network connections, and storage devices such as hard drives and memory. The OS also provides services to facilitate the efficient execution and management of, and memory allocations for, software application programs.
- Firmware – Firmware is a type of software that is written directly for a piece of hardware. It operates without going through APIs, the operating system, or device drivers—providing the needed instructions and guidance to communicate with other devices or perform basic tasks and functions as intended.
- Middleware – Middleware is a software layer situated between applications and operating systems. Middleware is often used in distributed systems where it simplifies software development by providing the following:
- Hiding the intricacies of distributed applications
- Masking the heterogeneity of hardware, operating systems and protocols
- Providing uniform and high-level interfaces used to make interoperable, reusable and portable applications.
- Delivering a set of common services that minimizes duplication of efforts and enhances collaboration between applications
- Application – The end-user develops the final software application that runs on the operating system, uses or interacts with the middleware and firmware, and is the primary focus of the embedded systems' target function. Each end application is unique, while operating systems and firmware can be identical from device to device.
Embedded software vs embedded systems
The hardware components within a device running embedded software are called an "embedded system." Some examples of hardware components used in embedded systems are power supply circuits, central processing units, flash memory devices, timers and serial communication ports. During a device's early design phases, the hardware that will make up the embedded system – and its configuration within the device – is decided. Then, embedded software is developed from scratch to run exclusively on that hardware in that precise configuration. This makes embedded software design a specialized field requiring deep knowledge of hardware capabilities and computer programming.
Examples of embedded software-based functions
Almost every device with circuit boards and computer chips has these components arranged into an embedded software system. As a result, embedded software systems are ubiquitous in everyday life and are found throughout consumer, industrial, automotive, aerospace, medical, commercial, telecom and military technology.
Common examples of embedded software-based features include:
- Image processing systems found in medical imaging equipment
- Fly-by-wire control systems found in aircraft
- Motion detection systems in security cameras
- Traffic control systems found in traffic lights
- Timing and automation systems found in smart home devices
What are the different types of embedded systems?
When based on performance and functional requirements, there are five main classes of embedded systems:
- Real-time embedded systems complete tasks in a deterministic and repeatable manner, which is affected by the operating systems' underlying architecture and scheduling, as well as the performance of threads, branching and interrupting latency. General-purpose embedded systems do not contain a real-time requirement and can manage interrupts or branching without a dependency upon a completion time. Graphics displays and keyboard and mouse management are good examples of general systems.
- Stand-alone embedded systems can complete tasks without a host system or external processing resources. They can output or receive data from connected devices but are not reliant on them to complete their task.
- Stand-alone embedded systems can complete their task without a host system or external processing resources. They can output or receive data from connected devices but are not reliant on them to complete their task.
- Networked embedded systems depend on a connected network to perform assigned tasks.
- Based on the complexity of the system's hardware architecture, there are three main types of embedded systems: Networked embedded systems depend on a connected network to perform assigned tasks.
How end-markets affect embedded systems
Embedded system requirements and components will differ according to the target market's demands. Some examples include:
- Consumer – In applications like consumer goods such as washers, wearable devices and mobile phones embedded systems emphasize the reduced size of the
- System-on-chip, low-power consumption or battery operation and graphics interfaces. In these applications, configurable operating systems and the ability to shut off non-operating “domains” of the design are valued.
- Networking – Applications that enable connectivity, communication, operations and management of an enterprise network. It provides the communication path and services between users, processes, applications, services and external networks/the internet. Embedded network applications focus on speed of response, packet processing and peripheral hardware paths.
- Industrial – For applications such as factory floor management, motors and windmills, the emphasis tends to secure cloud connectivity and deterministic “real-time” operation and can focus heavily on middleware.
- Medical, Automotive and Aerospace – These industries need mixed-safety critical systems, where portions of the design are isolated from each other to ensure only necessary data enters or leaves the system (security) while guaranteeing no harm to the end-user (safety). Examples are autonomous driving systems in automobiles and medical devices. These embedded systems can feature a mix of open source (Linux) and deterministic real-time operating systems (RTOS) and heavily utilize proven middleware.
Why is automotive embedded software different?
In automotive electronics, complex real-time interactions occur across multiple embedded systems that each control functions such as braking, steering, suspension, powertrain, etc. The physical housing containing each embedded system is referred to as an electronic control unit (ECU). Each ECU and its embedded software is part of a complex electrical architecture known as a distributed system.
By communicating with each other, the ECUs that make up a vehicle’s distributed system can execute a variety of functions, such as automatic emergency braking, adaptive cruise control, stability control, adaptive headlights and much more. A single function might need interactions across 20 or more embedded software applications spread across numerous ECUs connected by multiple networking protocols. Complex control algorithms deployed with the embedded software ensure the proper timing of functions, needed inputs and outputs and data security.
Common examples of automotive software application-based features include:
- ADAS (Advanced Driver Assist Systems) features like adaptive cruise control, automatic emergency braking, lane-keep assist, traffic-assist, lane-departure warnings
- Battery management
- Torque compensation
- Fuel injection rate control
ECU software stack
The Electronic Control Unit or ECU is comprised of a main computing unit with chip-level hardware and a stack of embedded software. However, there is an increasing trend among automotive manufacturers to design ECUs with complex integrated circuits that contain multiple computing cores on a single chip – what is referred to as a System on a Chip (SoC). These SoCs can host a multitude of ECU abstractions in order to consolidate hardware. The software stack for an ECU typically includes a range of solutions, from low-level firmware to high-level embedded software applications.
ECU Stack | Description |
Embedded software application | Control algorithms, processing, services |
Application framework | Security & safety frameworks |
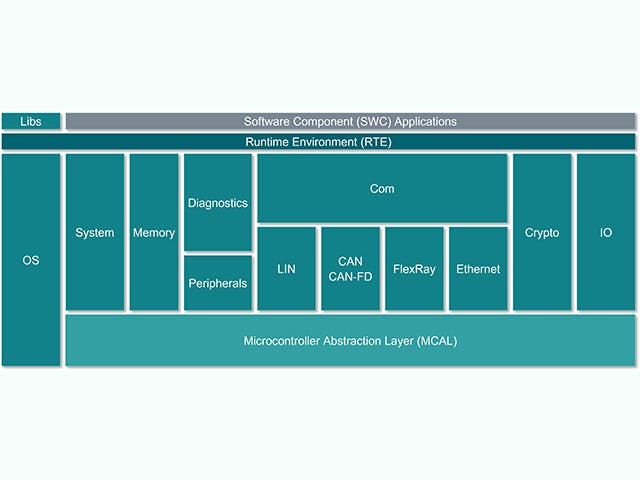
Operating environment | AUTOSAR classic, AUTOSAR Adaptive, Inputs/Output channels |
Embedded virtualizations | Real-time OS, ECU abstractions |
Firmware | Boot-loaders, secure-storage, secure-threading |
Hardware | Silicon-based devices, micro-controllers, single or multiple layered boards |