Questa Visualizer Debug
High performance, scalable, context-aware debug supporting the complete logic verification flow including simulation, emulation, prototyping, testbench, low-power, and assertion analysis. Intuitive and easy to use, Visualizer improves debug productivity of today's complex SoCs and FPGAs.
Get in touch with our sales team 1-800-547-3000
Debug Complex, Mixed Verification Environments
Visualizer has several features that improve debug productivity for SystemVerilog/UVM, transaction-level, RTL, gate-level and low-power design and verification. It provides a full set of synchronized views for analyzing waveforms, source code, and connectivity.
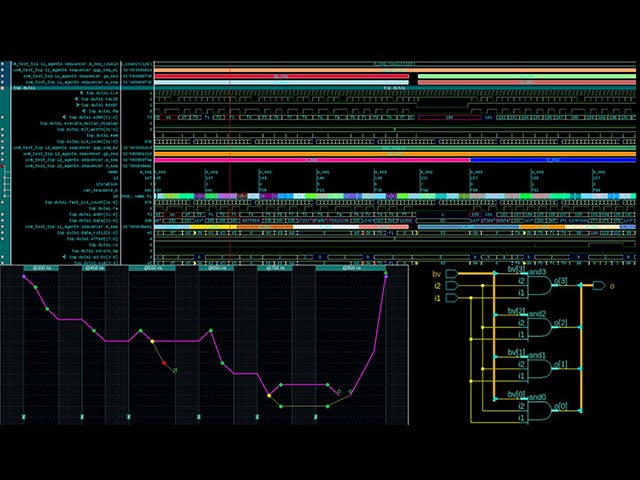
Wave with Transaction Coloring and Biometric Search
Class object handles from the driver in a UVM testbench. These are all the transactions that were sent from the sequencer to the driver. The Virtual interface is also shown, along with the transactions from the channel. Additionally the values displayed are colored according to the biometric searches that have been created.

TimeCone
The Visualizer Debug Environment allows you to find unknowns (X values), trace an event back in time to the root cause of that event through multiple clock domains and find origins of unknowns using the Time Cone window.

Connectivity Tracer
Automatic fan-in display using signal highlight from a signal back to the next primary input or flip flop.

Logic Cone
The Logic Cone window allows you to explore the “physical” connectivity of your design, to trace signals that propagate through the design, and to identify the cause of unexpected inputs, by showing a graphic view of the RTL objects in your design.

Ready to talk to someone today?
We're standing by to answer your questions.
Get in touch with our sales team 1-800-547-3000 or 1-503-685-8000
Verification Academy
Verification Academy provides the skills necessary to mature an organization's functional verification process capabilities, providing a methodological bridge between high-level value propositions and the low-level details.
Verification Horizons Blog
Insight and updates on concepts, values, standards, methodologies, and examples to assist with the understanding of what advanced functional verification technologies can do and how to most effectively apply them.
Verification Horizons Issue
The Verification Horizons publication provides concepts, values, methodologies and examples to assist with the understanding of what advanced functional verification technologies can do and how to most effectively apply them.